
See what changed, why it mattered, and share it before the morning huddle.
CPNET compares A/B/C shifts side-by-side—process deltas, quality attributes, and alert load—then auto-builds a shift report for your daily production and handoff meetings.
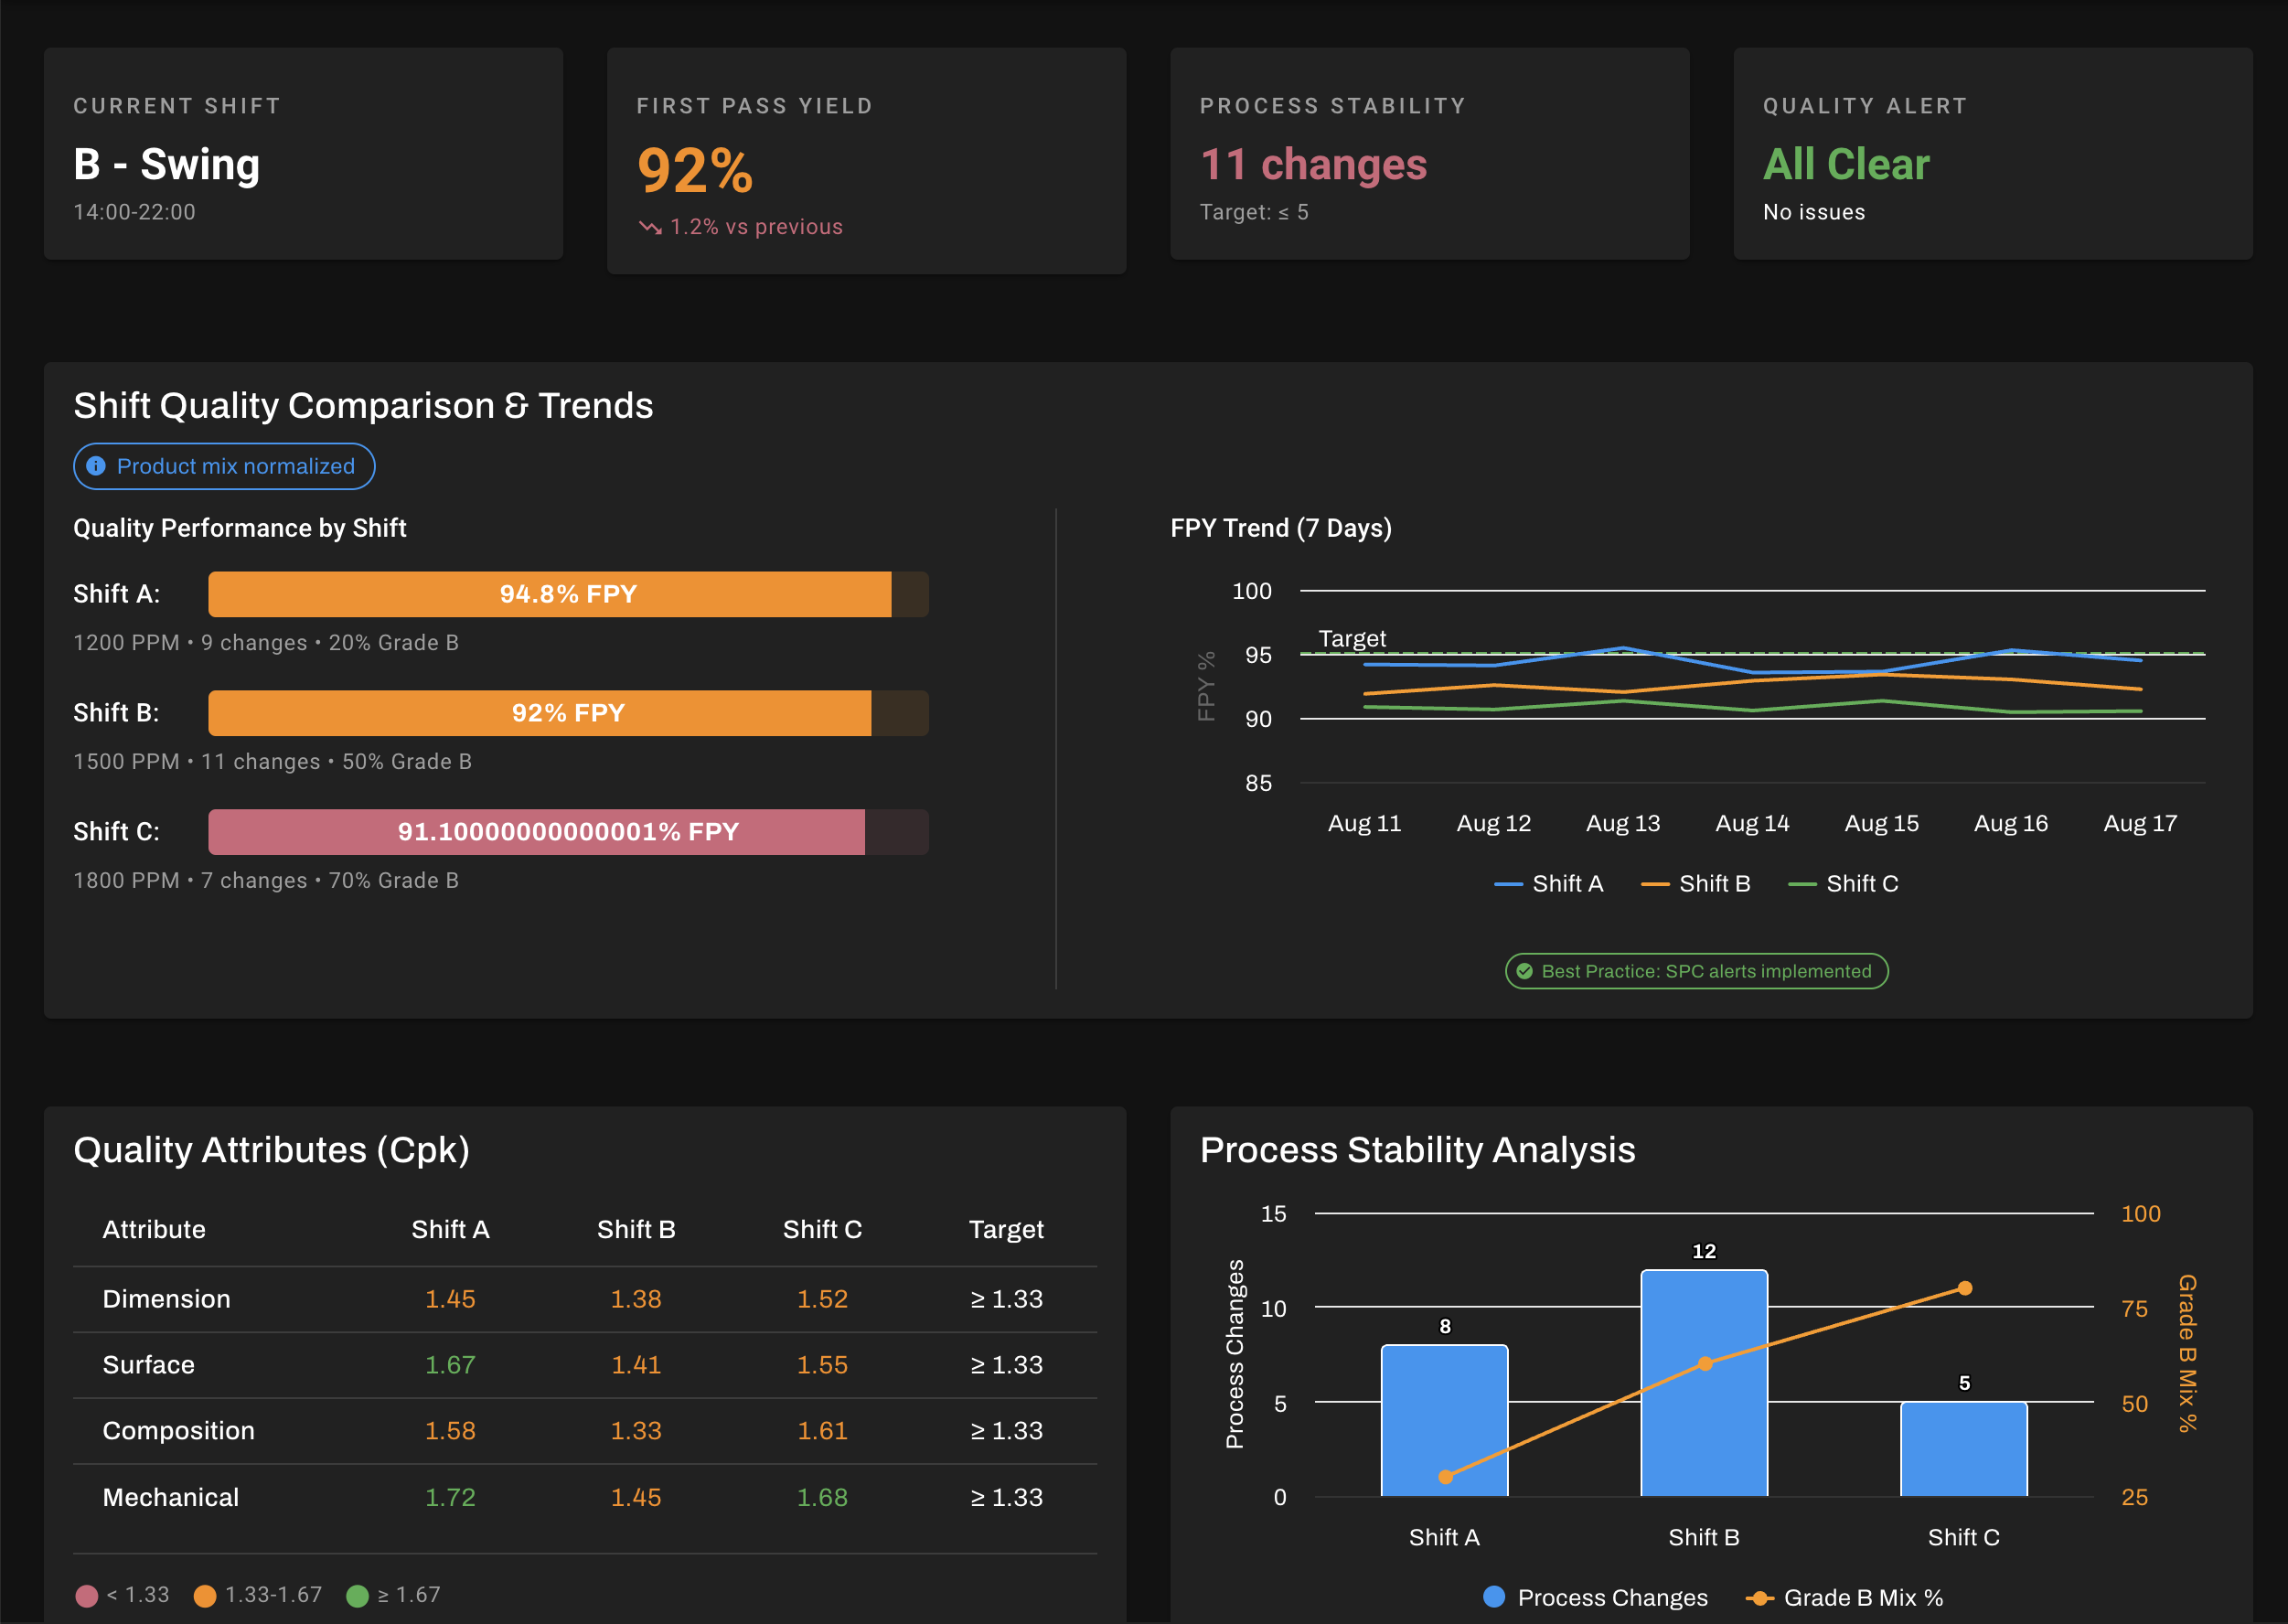
What is CPNET Shift Change / Efficiency Tracker?
A purpose-built view that blends historian/MES/quality data with shift calendars and crews to show the true, normalized performance of each shift. It highlights what changed around the handoff window (e.g., −30 / +60 minutes), quantifies the impact on throughput, scrap, startup time, and alerts, and automates the daily shift report—no more spreadsheet stitching.
Built for: steel, plastics, construction materials, and other continuous manufacturing where shift differences drive cost, quality, and uptime.
How customers use CPNET for Shift Efficiency
Connect & define shifts
Map shift calendars/rosters and the analysis window (e.g., −30 / +60 min around change). Select site, line, and grade.
Normalize for apples-to-apples
CPNET adjusts KPIs by grade mix, planned downtime, ambient, and current recipe so crew comparisons reflect reality—not noise.
Compare shifts at a glance
See OEE components, startup duration, time-to-steady, scrap %, throughput/hr, energy/ton, plus alert counts & severity by shift and over time.
Handoff window analyzer
Zoom into the boundary: setpoint churn, spec-ratio spikes, alarm bursts, operator actions, and stabilization lag.
Quality & process drivers
Correlation/importance views tie quality attributes (e.g., gauge Cpk, adhesion, density) to specific process changes made around shift change.
Auto shift report
Generate a meeting-ready Shift Report with KPIs, exceptions, root-cause notes, and open actions—export to PDF/CSV and (optionally) schedule email delivery at end-of-shift or before the daily stand-up.
Optional: If you also use Rx+, you can convert insights into guardrails or small experiments later—but this tracker stands on its own as analytics + reporting
Why teams choose CPNET for Shift Tracking
Fair comparisons, fast answers – Normalization removes bias from product mix and downtime.
One click to the truth – Process deltas, quality impacts, and alert loads in one view.
Exception-based reviews – Focus the meeting on what changed and why, not data wrangling.
Meeting-ready reports – Automated, consistent, and auditable—email or print.
Works with your stack – Historian/MES/LIMS + shift calendars in; dashboards and reports out.
Ready to make every shift a best practice?
Replace manual data gathering with a live, fair, and automated view of shift performance—and walk into the meeting with answers, not spreadsheets.
Let’s talk. We’ll stand up the Shift Change / Efficiency Tracker on your lines and auto-deliver your first Shift Report.
- Get Started